Source Visualisation
![]() open the source visualisation utility
open the source visualisation utility
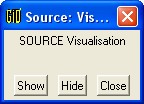
Show : show the source
Hide : hide the source
Close : hide the source and close the utility
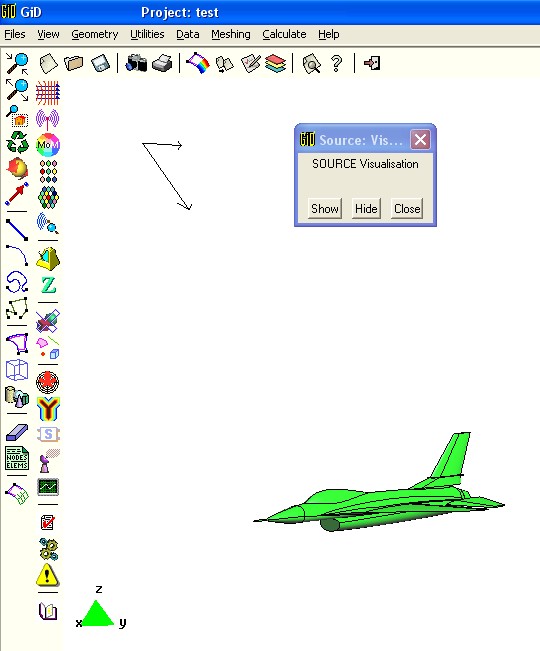
Plane wave :
If the source is a plane wave, it will be represented by 2 arrows. The long one represents the the direction of incidence. The short one represents the polarisation of the electric field.
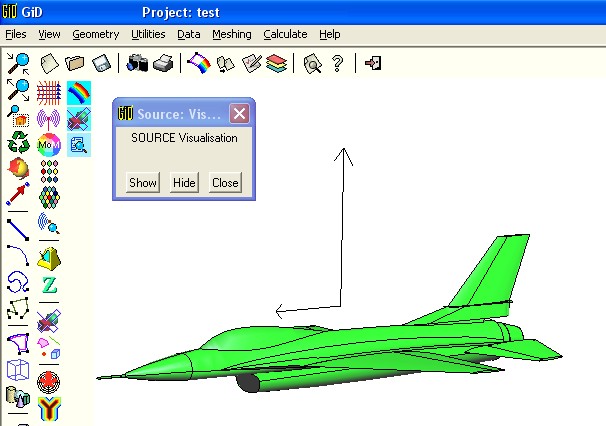
Source point :
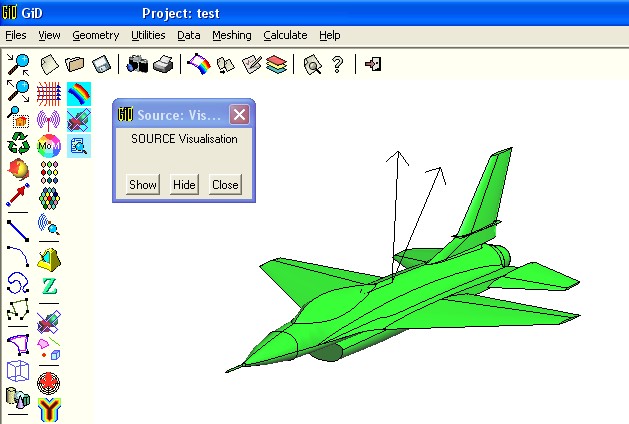
If the source is a source point, it will be represented by 2 arrows. If the source is an array of source points, each element will be represented by a couple of arrows. These arrows start at the source point location. The long one represents the initial axis for the theta angle. The short one represents the initial axis for the phi angle. In other words, these arrows show how the radiation pattern is oriented :
In the case of a source on a surface, a another long arrow will appear to show the normal of the surface :
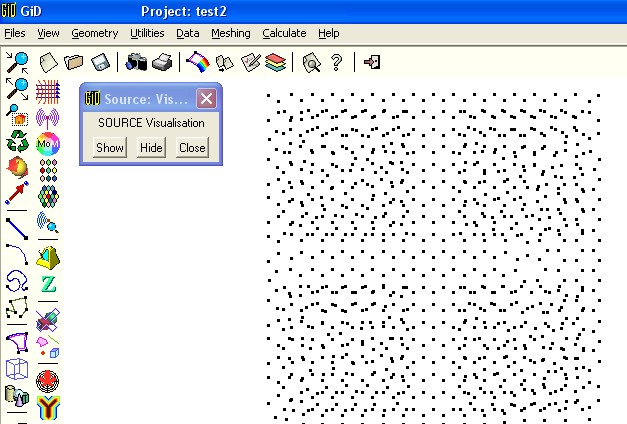
MoM distribution :
If the source is a MoM distribution, each dipole will be represented by a point (the render must be off) :
Copyright © 2009, IEEA